Which Luxury Cars Hold Their Value Best: Five-Year Depreciation by Marque and Segment
Depreciation is the single largest line item in luxury car ownership, and it is the one most buyers estimate worst. Insurance, service, tires and fuel are visible costs that arrive as invoices; depreciation arrives silently and only presents itself at resale.
The data is unambiguous on scale. iSeeCars' long-running five-year depreciation study puts the average new vehicle at roughly 45% loss over five years, while the luxury segment consistently depreciates faster than the market as a whole — several luxury sedans and EVs in that study exceed 60% loss over the same period.
That average conceals a spread of more than thirty percentage points. Understanding which side of that spread a given car falls on is a matter of production volume, drivetrain, transmission, specification and marque discipline — and each of those factors can be reasoned about before you sign.
How Depreciation Is Actually Measured
Before comparing figures, it is worth knowing that published depreciation numbers are not interchangeable. Different sources measure different things, and quoting them together without adjustment produces misleading conclusions.
iSeeCars analyzes millions of used-car listings and reports five-year depreciation as the difference between original MSRP and current average used listing price. KBB and Edmunds model projected residual values forward from new, which is the figure lenders and lease-writers use.
Hagerty, by contrast, tracks collector-market values through insured-value data and auction results, which is the only relevant lens once a car has bottomed out and begun appreciating. A car can show heavy depreciation in an iSeeCars listing study while showing a rising Hagerty value curve, because the two are measuring different populations of the same model.
One more caveat applies to every figure below. Published depreciation is calculated against base MSRP, and luxury buyers rarely buy base cars — a heavily optioned example recovers a far smaller share of its as-delivered price than the headline percentage suggests.
Five-Year Retention By Segment
Segment is the strongest single predictor of retention within the luxury field. The table below summarizes the directional picture drawn from iSeeCars five-year depreciation studies, KBB residual modeling and Edmunds true-cost data.
| Segment | Typical 5-year retention | Direction of travel | |---|---|---| | Limited-production supercars and specials | 80–110%+ of MSRP | Flat to appreciating; allocation-gated | | Sports cars (911-class) | 55–70% | Strongest mainstream retention | | Luxury and performance SUVs | 45–60% | Mid-pack; spec-sensitive | | Grand tourers and coupes | 40–55% | Below average; option-heavy cars fare worst | | Full-size luxury sedans | 30–45% | Weakest in the field | | Luxury EVs | 30–45% | Weak; pricing and battery cycle pressure |
Retention figures are ranges drawn from published iSeeCars, KBB and Edmunds data and should be treated as directional; individual examples vary widely by specification, mileage and condition tier.
Sports Cars Lead The Mainstream Field
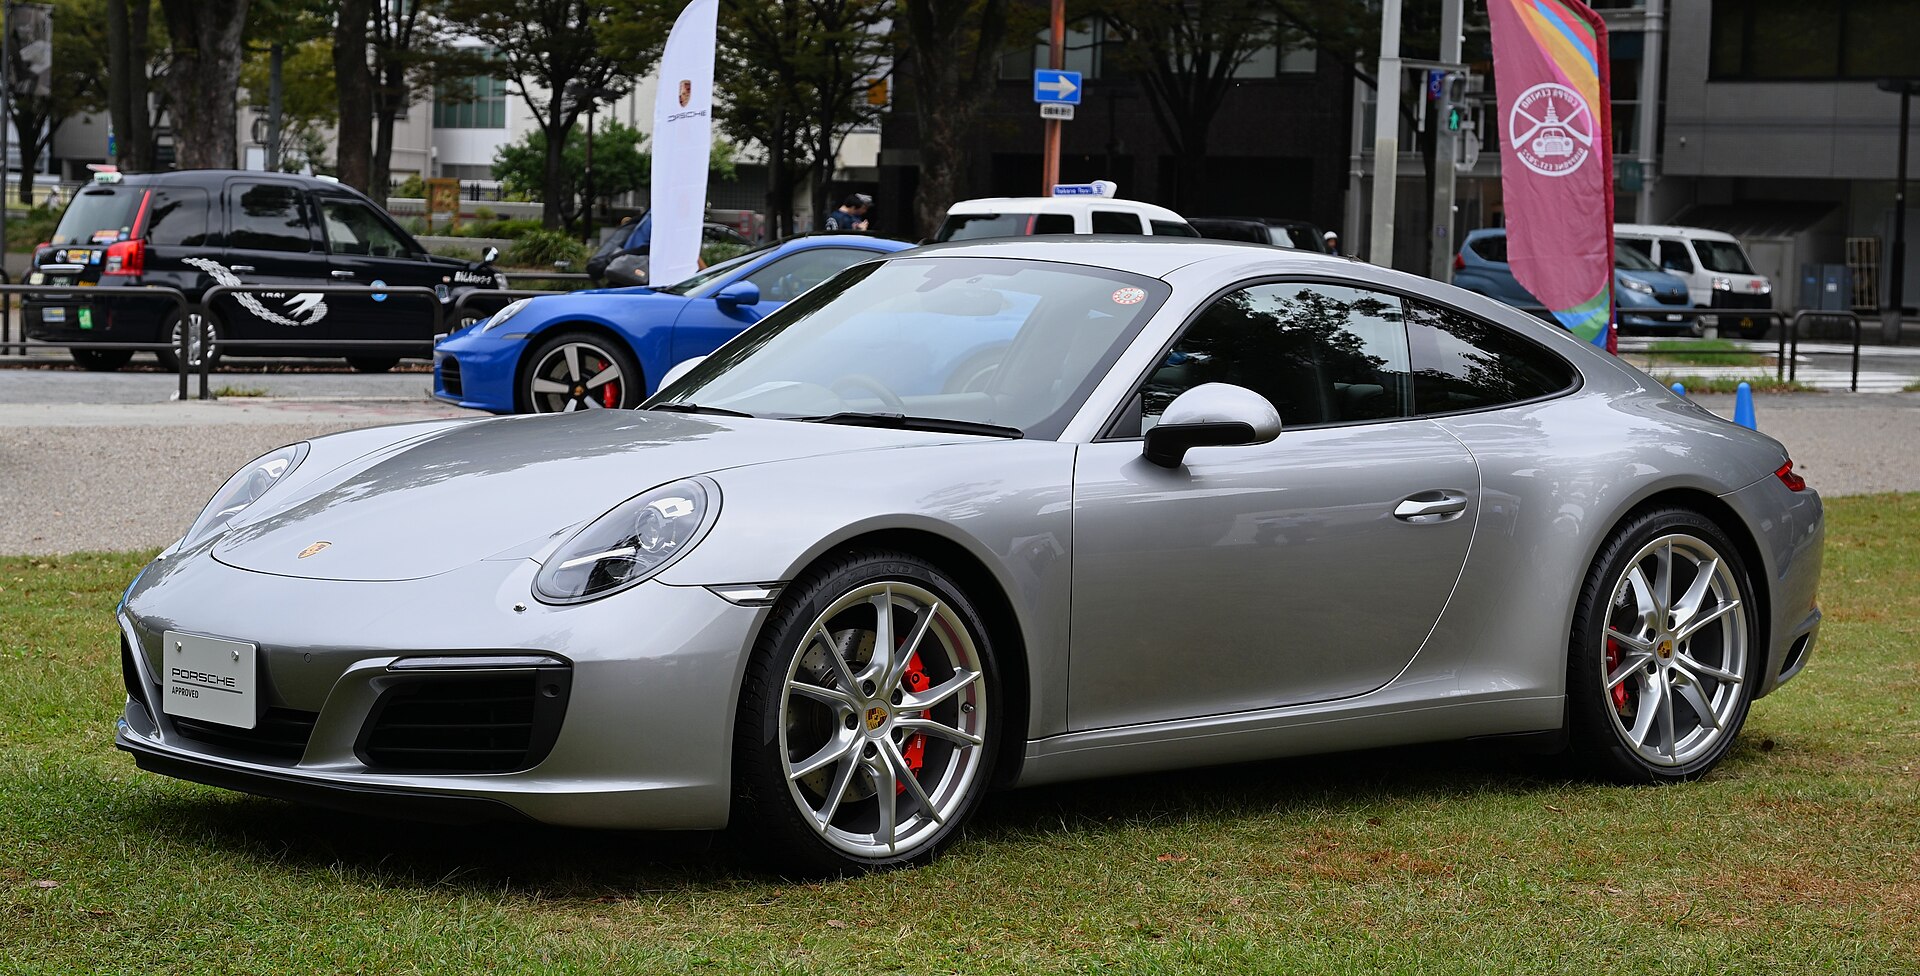
Porsche is the reference point here, and the reason is structural rather than reputational. iSeeCars has repeatedly ranked the 911 among the slowest-depreciating vehicles sold in the United States across all categories, not merely within luxury.
The mechanism is supply discipline paired with a deep, informed buyer pool. Porsche does not flood the market, the cars are engineered for high-mileage durability, and the enthusiast base treats specific configurations — manual transmission, naturally-aspirated engines, Touring specification — as scarce goods. Our analysis of the best model year for a used 911 Turbo S walks through how that plays out generation by generation.
Full-Size Sedans Are The Weakest Position
The German full-size sedans sit at the other extreme. iSeeCars studies have repeatedly placed large luxury sedans among the fastest-depreciating vehicles on the market, with several exceeding 60% five-year loss.
Three forces compound here. Original transaction prices are high and heavily incentivized, lease returns deliver predictable volume into the used market on a three-year cycle, and out-of-warranty service exposure on complex air-suspension and electronics packages suppresses second-owner demand. Our luxury sedan comparison covers where within that segment the damage is least severe.
SUVs Occupy The Middle
Luxury and performance SUVs have held up better than sedans through the current cycle, largely because demand has not softened the way sedan demand has. Within the segment, retention tracks closely with production discipline — the more constrained the model, the flatter the curve.
Specification matters more here than in any other segment, because SUVs carry the longest option lists. A well-specified example in a conservative color recovers a materially higher share than a heavily personalized one, a pattern we trace in detail across the Bentayga, Cullinan, Urus and Purosangue.
The Structural Reasons Some Cars Resist Depreciation
Retention is not a brand attribute. It is the output of five identifiable mechanisms, and any given model can be scored against them before purchase.
- Production volume relative to demand. The tightest correlation in the entire dataset. Cars built in numbers below sustained demand hold a floor; cars built to meet volume targets do not.
- Allocation gating. When a manufacturer restricts who may buy a car new, the secondary market prices in access rather than merely metal. This is the dominant force in Ferrari and Porsche specials, and we cover the mechanics in allocation reality.
- Drivetrain scarcity. Naturally-aspirated engines and gated or true three-pedal manuals command persistent premiums, and that premium has widened as both configurations disappear from production.
- Service-cost transparency. A model with a knowable maintenance schedule and available parts supports second-owner confidence. One with unpredictable major-service exposure does not — see our breakdown of Ferrari service costs by model.
- Specification conservatism. Paint-to-sample and bespoke commissions can add value at the very top of the market, but personalized interiors in the mainstream luxury field narrow the buyer pool and cost money at resale.
Where The Curve Flattens
Every depreciation curve has an inflection point. For mainstream luxury cars, the steepest loss occurs in years one through three, after which the curve flattens as the car exits the lease-return population.
This is the structural basis of the used-market sweet spot: buying after the first owner has absorbed the steep segment and before service exposure escalates. We apply that logic model by model in our analysis of the used Ferrari depreciation sweet spot and in the timing case for a used Rolls-Royce Cullinan.
The Cars That Stop Depreciating Entirely
At the limited-production end, the depreciation framework stops applying. Hagerty's collector-value tracking follows a different curve — a decline to a floor, a period of stability, then appreciation driven by scarcity and cultural standing.
The Lexus LFA is the cleanest illustration in the modern era: 500 cars built, a naturally-aspirated V10 with no successor, and a market that now trades well above original MSRP. We document that trajectory in Lexus LFA values.
The operative distinction is between cars that are expensive and cars that are scarce. Price alone has never protected a car from depreciation; constrained supply against durable demand is the only thing that ever has.
Price has never protected a car from depreciation. Constrained supply against durable demand is the only thing that ever has.
Reading Retention Against Total Cost
Depreciation should be evaluated alongside the rest of the ownership ledger rather than in isolation. A car with superior retention can still be the more expensive proposition if service intervals, consumables and insurance run high.
A 911 and a comparably priced grand tourer can diverge by five figures annually on maintenance and insurance alone, which is enough to overturn a ten-point retention advantage. Our work on supercar ownership costs and supercar insurance sets out the figures that belong on the other side of that ledger.
Financing structure compounds the effect. A car that depreciates faster than the amortization schedule leaves the owner underwater for a longer stretch of the term, which is a live consideration covered in exotic car financing.
Editorial Recommendation
If minimizing five-year loss is the primary objective, the decision rules are consistent across the data.
- Buy scarcity, not price. Production volume relative to demand predicts retention better than MSRP, marque or segment.
- Prefer the sports-car segment. Porsche's 911 lineage has the strongest documented retention in mainstream luxury per iSeeCars, and the manual and naturally-aspirated variants sit at the top of that range.
- Specify conservatively. Performance and comfort options that the next buyer will also want return a share of their cost; personalization returns almost none.
- Buy at the inflection, not at delivery. A three-to-four-year-old example under warranty or CPO coverage captures the flat part of the curve and transfers the steep part to the first owner.
- Avoid the full-size sedan and mainstream luxury EV segments if resale is a decision factor. Both carry structural headwinds that no specification choice offsets.
- Commission a pre-purchase inspection regardless. Condition tier and documented service history move realized value more than any published depreciation percentage.
Verify every figure against current iSeeCars, KBB, Edmunds and Hagerty data before you transact. Depreciation curves move with interest rates, production announcements and model-cycle timing, and a study published eighteen months ago may no longer describe the market you are buying into.
If you are narrowing a shortlist, our luxury SUV comparison and performance SUV comparison place individual models against one another on the same terms used here.